Subscribe to our Telegram channel

Analysts have named 3 signs of the beginning of bitcoin’s historic growth
A growing number of online indicators are indicating that the market is reaching a critical point in the bitcoin cycle. Although each indicator tracks different activities on the BTC blockchain, their long-term structure allows us to see cyclical changes that have correlated with the beginning of a bull market in the past.
The fair value of BTC has started to grow
Value map
BTC
$70,432.79
Mezo Wrapped BTC
3.74%
Market capitalization
$39.37 million
VOL. 24 hours
$2.11 billion
is an indicator created by the famous crypto analyst @therationalroot. It looks like a 4-color bar with a green median and indicates the so-called «fair value» of an asset. If the BTC price is near this line, the valuation of the largest cryptocurrency is neither overvalued nor undervalued.
Deviations from the «fair value» indicate that bitcoin is overvalued or undervalued. The yellow and red bars rise above the green bar during bull markets, and the light and dark blue bars fall below it when the initiative is taken by the bears.
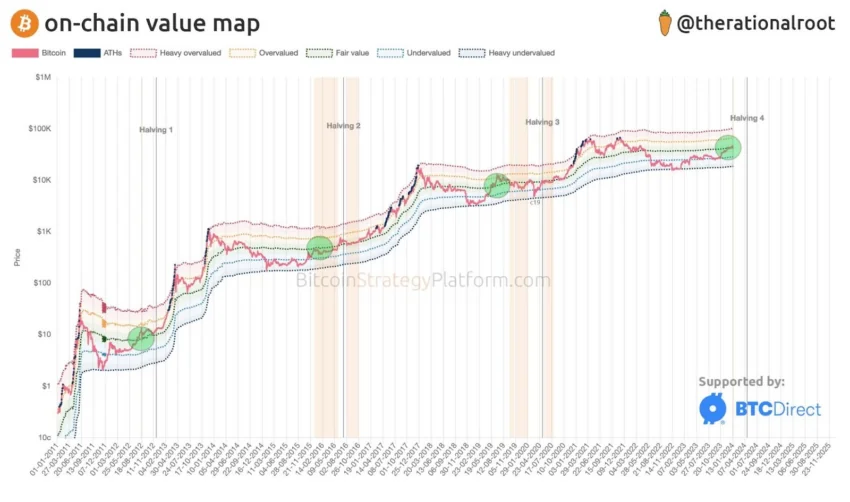
The above chart shows that the start of the rise in «fair value» coincided with the early stage of the bull market. The only exception was COVID-19 in early 2020. This event resulted in a short bear market, which turned out to be an opportunity to buy before the rise.
Realized market capitalization is moving up
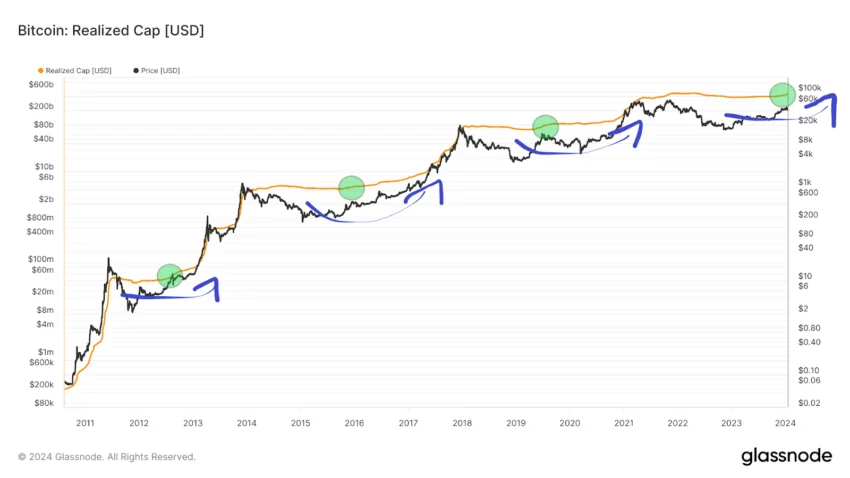
As explained by analysts, the realized market capitalization is calculated by valuing each UTXO at the price of the last movement. This indicator is considered more accurate than the «regular» BTC market capitalization.
All 4 bear markets resulted in a slight decline in realized capitalization and a multi-year sideways trend. The beginning of a new bull market always correlated with a reversal on the indicator’s chart, which began to move upward. At this time, the realized capitalization starts moving upward again, signaling a change in the long-term trend.
Long-term holders sell BTC
The actions of long-term and short-term cryptocurrency holders also hint at the possible start of a bull market. The indicator’s chart shows two curves corresponding to the resources held by long-term (blue) and short-term (red) investors.
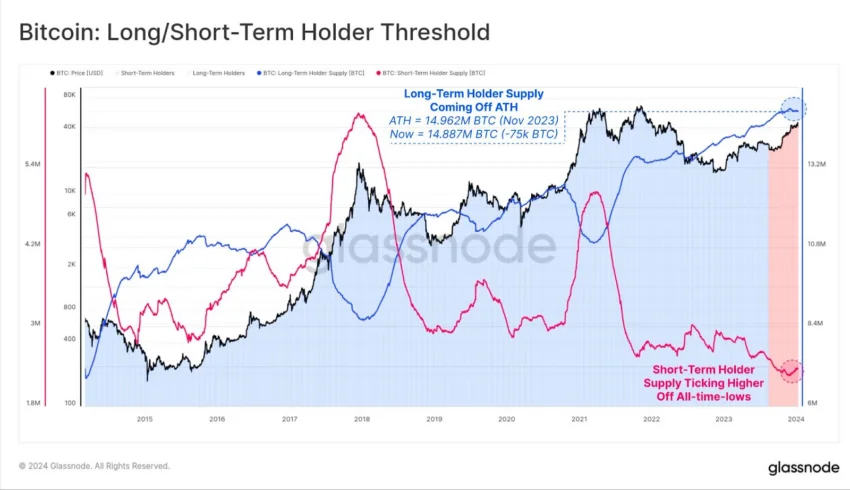
The historical connection between them is obvious: mature bull markets are characterized by a sharp decline in the blue line and a sharp rise in the red line. In other words, during a period of rapid growth in the BTC price, long-term holders sell assets to short-term market participants.
However, the situation quickly changes after the peak is reached. Then short-term holders start to panic and sell coins to long-term investors. Glassnode analysts noted that the blue line recently reached an all-time high, while the red line has just bounced off an all-time low.