Subscribe to our Telegram channel

Analysts predict a new all-time high for bitcoin
Bitcoin, Ethereum, and XRP continue to show positive dynamics as the upward trend in the cryptocurrency market continues. The key resistance levels that these assets are testing may determine the future direction of movement — either a new high or a short-term correction. Investors are focusing on bitcoin’s behavior near the $ 105,000 mark, which is critical.
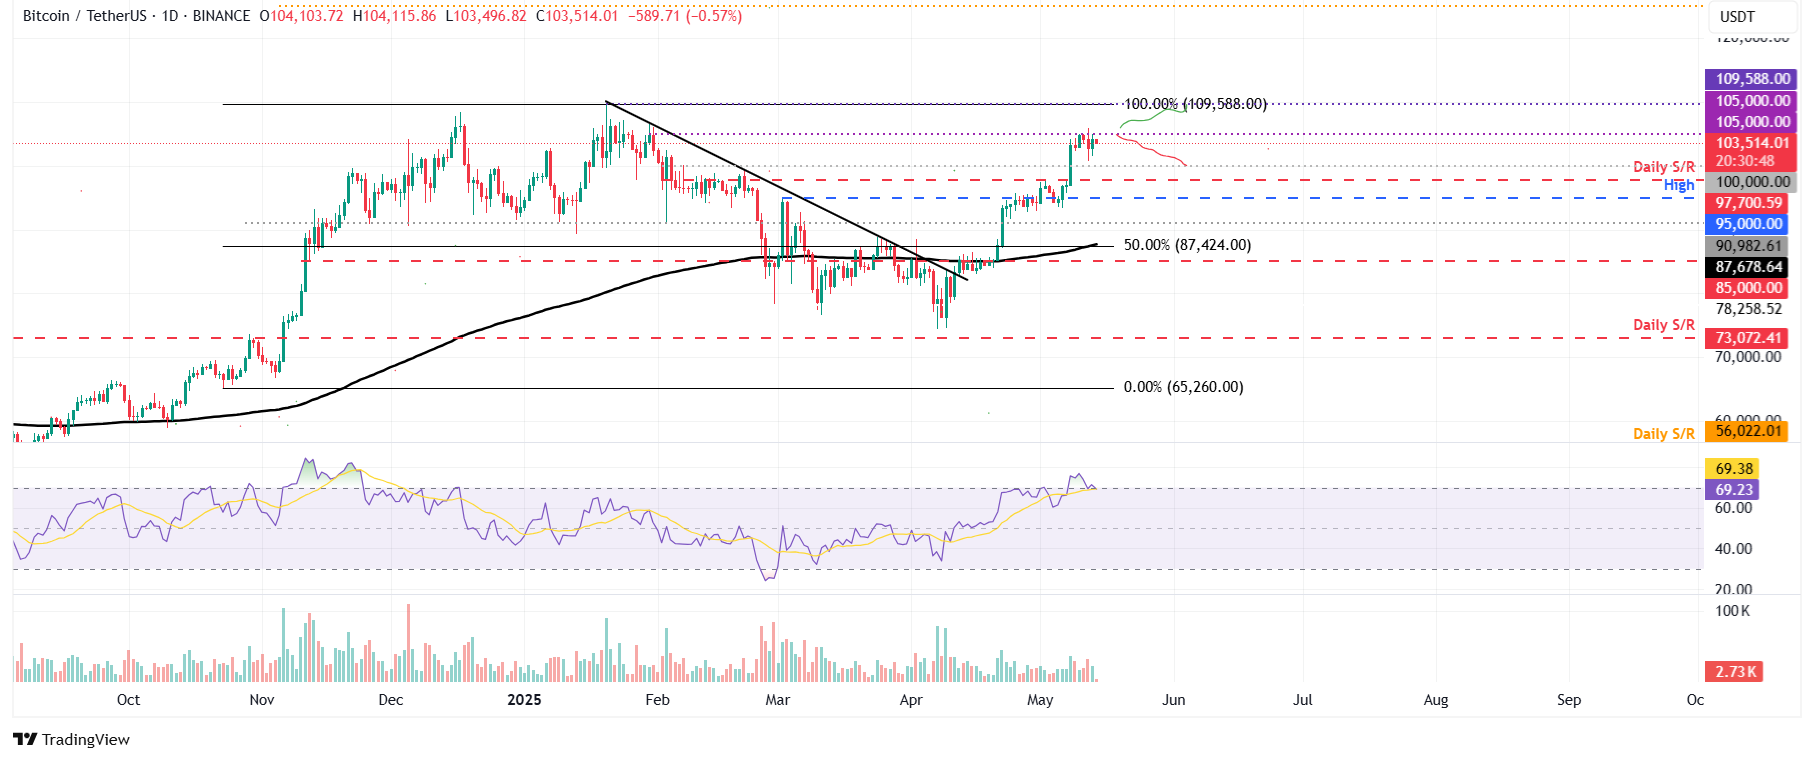
On Sunday, bitcoin BTC $70,607.20 Mezo Wrapped BTC 1.51% Market capitalization $41.65 million VOL. 24 hours $1.39 billion encountered resistance at $ 105,000 and lost 2% in value the next day. As of Wednesday, the price of BTC has dropped to around $ 103,600. If the correction continues, a decline to psychological support at $ 100,000 is likely. The Relative Strength Indicator (RSI) has fallen below 70, indicating a weakening of the bullish momentum. A further drop in the RSI below 50 could accelerate the price decline. At the same time, a close above $ 105,000 will open the way to the all-time high of $ 109,588 recorded on January 20.
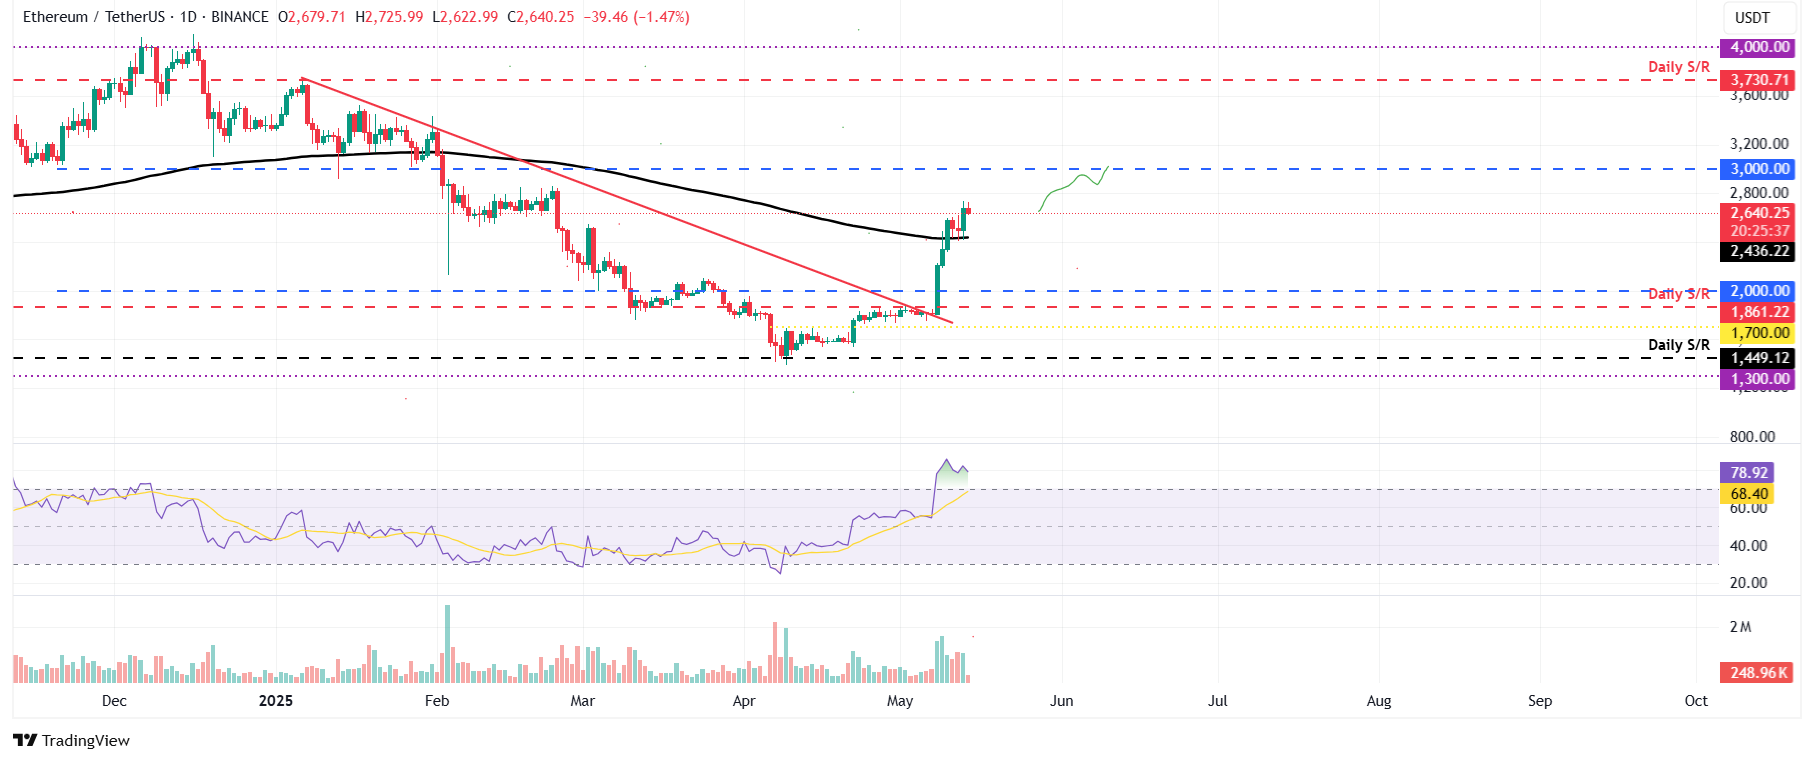
On Monday, the price of Ethereum ETH $2,164.72 Bridged Ether (StarkGate) 2.29% Market capitalization $40.8 million VOL. 24 hours $0.91 billion tested the 200-day exponential moving average (EMA) at $ 2,436 and on Tuesday rose by 7.38%. As of Wednesday, the asset was trading at around $ 2,640. If support remains at the EMA level, growth to $ 3,000 is possible. The RSI for ETH on the daily chart is 78, which exceeds the overbought zone, indicating a strong momentum but also increasing the risk of correction. If the indicator stays above 70, growth may continue.
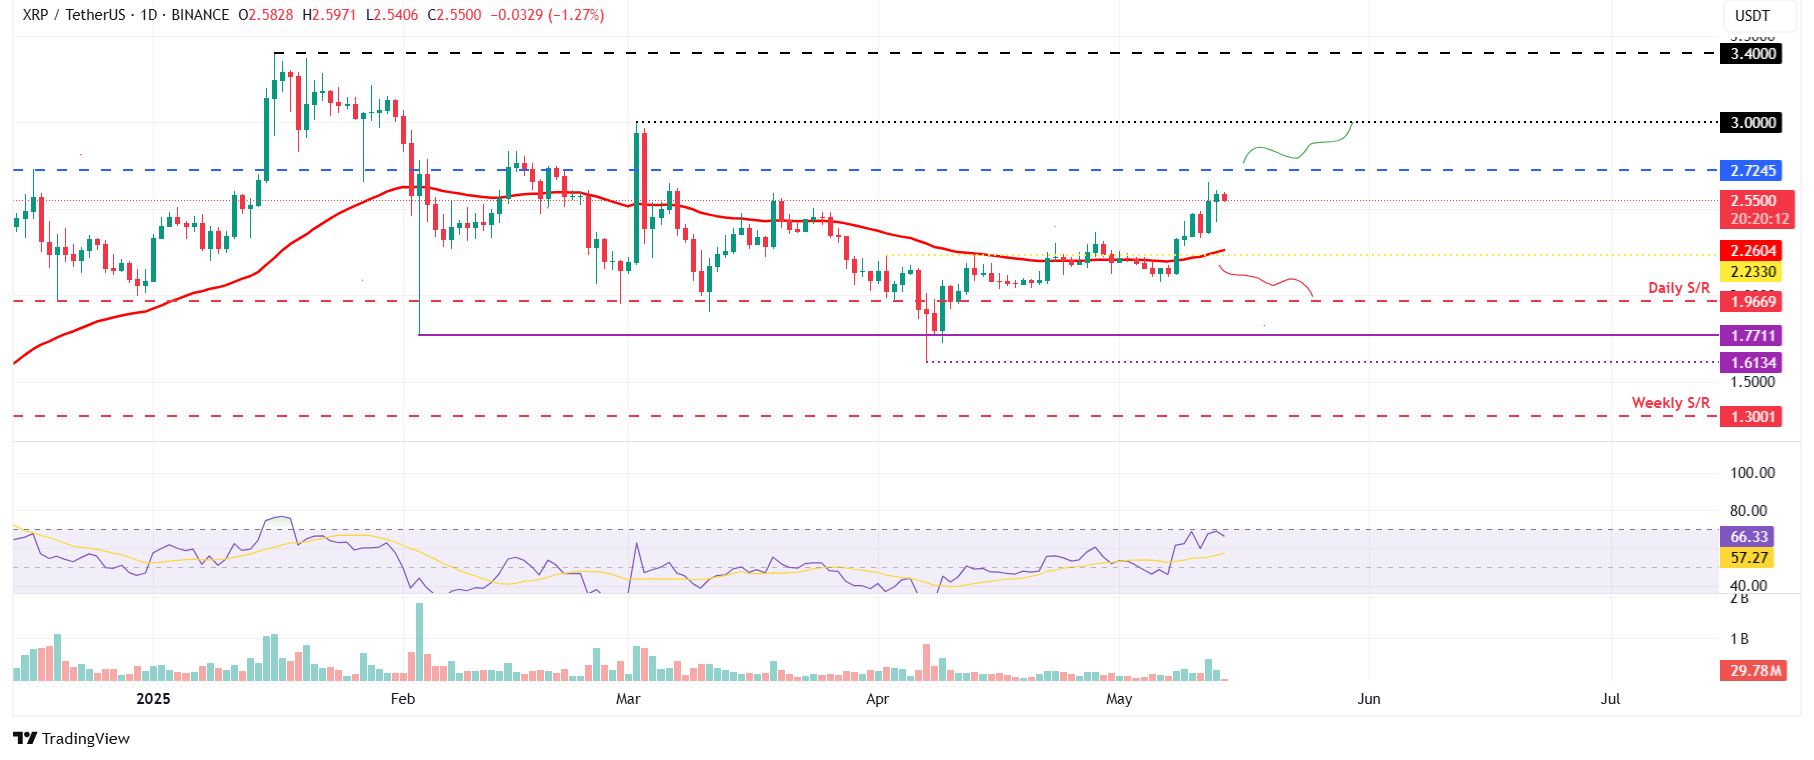
XRP XRP $1.42 XRP 0.50% Market capitalization $87.14 billion VOL. 24 hours $0.17 billion , in turn, is trading near an important resistance level at $ 2.72. After closing above the 50-day EMA ($ 2.26) on April 8, the token gained 21% and is currently holding at $ 2.55. In case of a breakout of $ 2.72, the price could quickly reach $ 3.00, an important psychological boundary. The RSI is at 66, bouncing off the overbought zone, which may signal a decrease in buyer pressure. If the indicator rises again, the trend may resume. In the event of a correction, support can be expected at the EMA level of $ 2.26.
In general, the cryptocurrency market remains positive, but further dynamics will depend on the ability of assets to hold and overcome key technical levels. Technical indicators, in particular RSI, remain key in predicting short-term changes in the charts of digital currencies.