Subscribe to our Telegram channel!

Bitcoin, Ethereum and Ripple recovered from market turbulence
At the beginning of the week, the top cryptocurrencies — Bitcoin, Ethereum, and Ripple — are showing signs of stabilization after recent market fluctuations. Bitcoin is consolidating after setting a new all-time high, while Ethereum and Ripple are holding above important support levels. This suggests that buyers may continue to have an advantage.
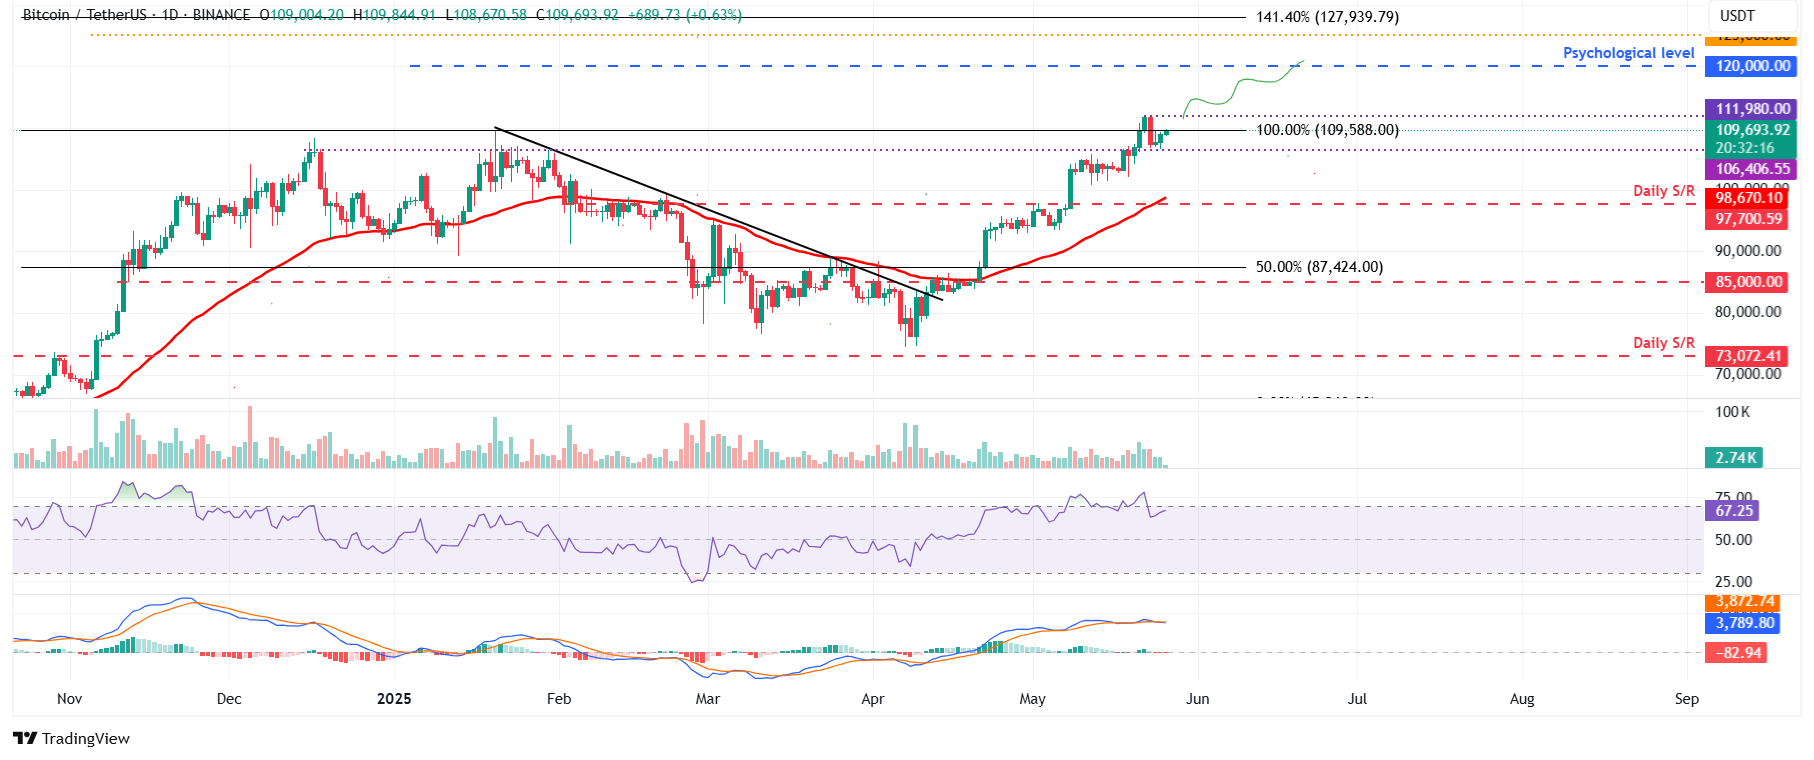
Bitcoin BTC $71,154.40 Mezo Wrapped BTC -0.78% Market capitalization $41.09 million VOL. 24 hours $0.8 billion reached a record high of $ 111,900 last Thursday, after which it lost 3.92% the next day. However, on Saturday, the asset found support at $ 106,406 and began a partial recovery. On Monday, at the time of writing, BTC is trading around $ 109,600. If the price manages to gain a foothold above the all-time high, it could open the way to the psychological limit of $ 120,000. The RSI indicator on the daily chart is 67, which indicates that the momentum on the buyers' side is still there, but the MACD is signaling uncertainty in the market.
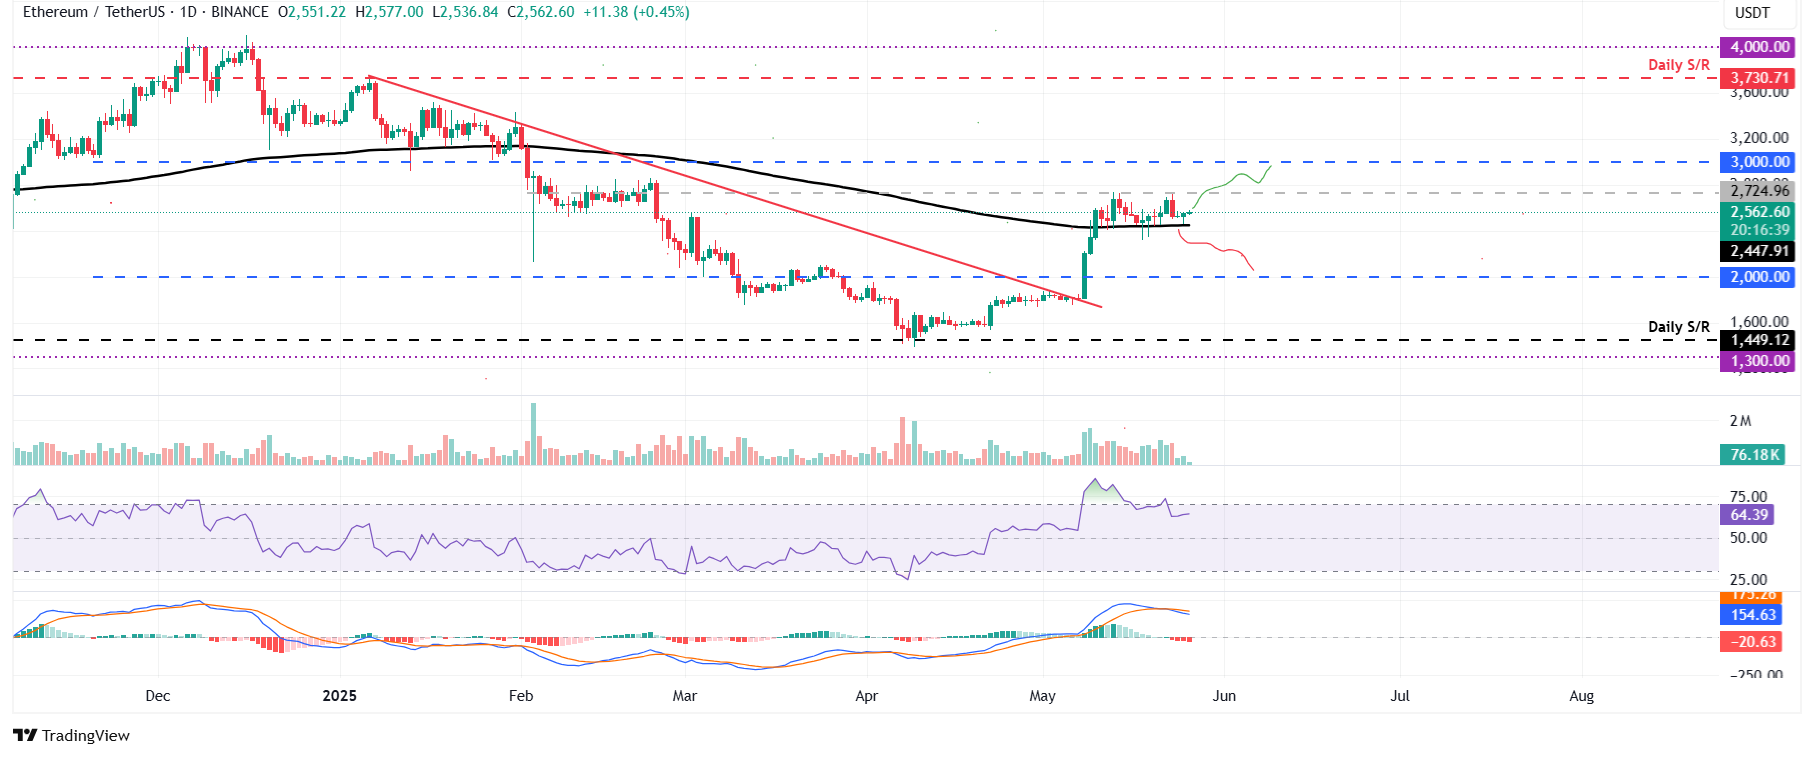
The price of Ethereum ETH $2,196.74 Bridged Ether (StarkGate) -0.95% Market capitalization $41.65 million VOL. 24 hours $0.41 billion encountered resistance at $ 2,724 on Friday and lost more than 5%. During the weekend, ETH tested the 200-day exponential moving average (EMA) at around $ 2,447, which acted as support. On Monday, ETH is trading around $ 2,500. If the support at the EMA level holds, the coin may try to retest the resistance at $ 2,724. The RSI remains at 64, which indicates potential for growth. At the same time, the MACD is showing a bearish crossover, which signals a possible continuation of the decline.
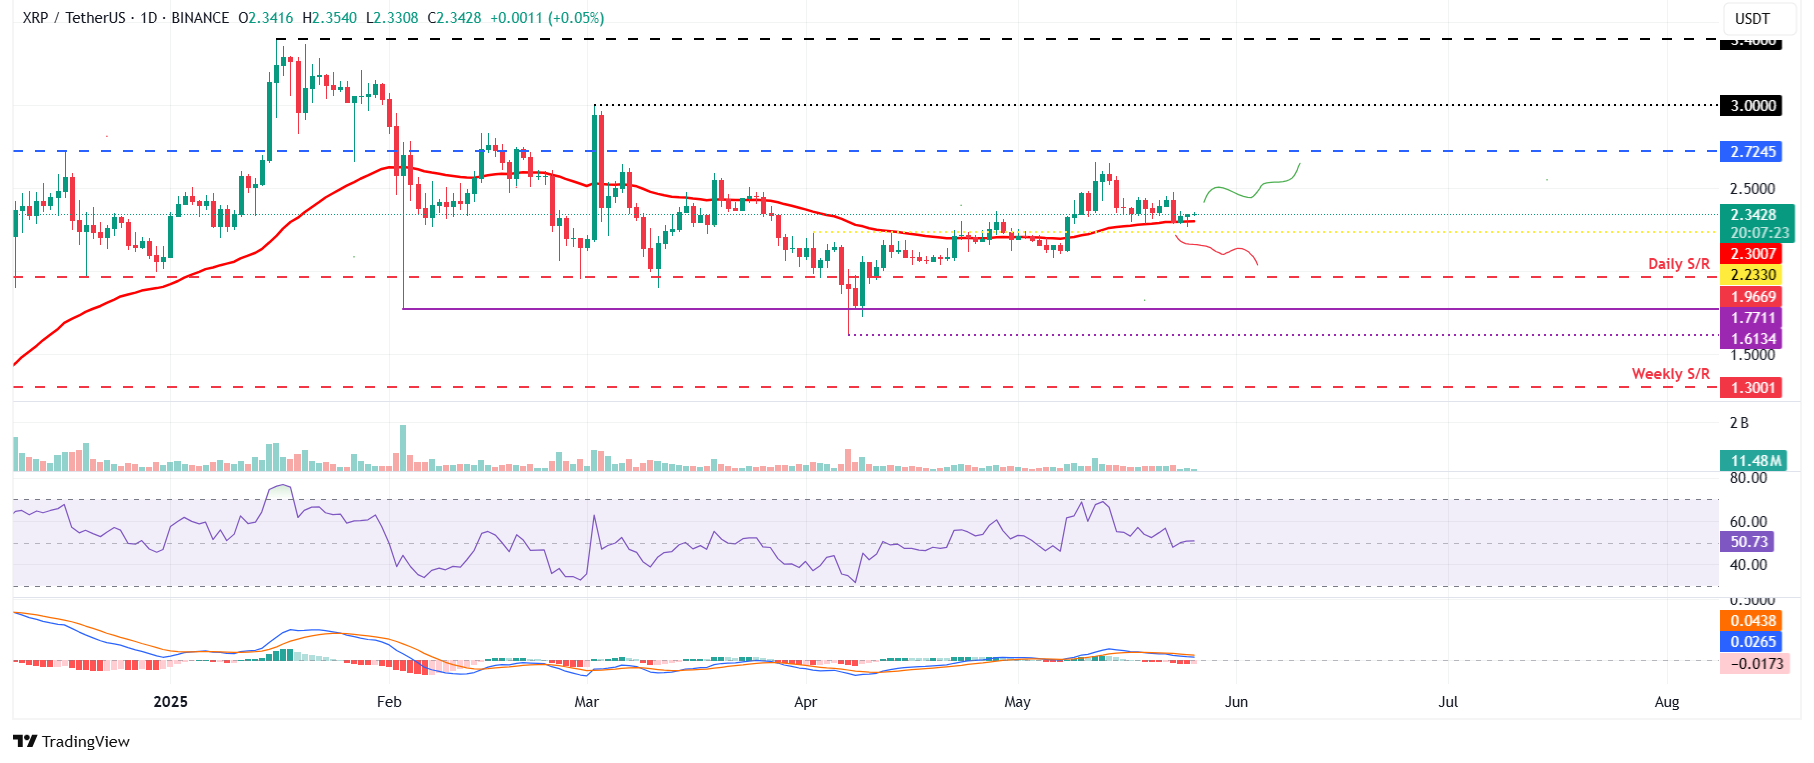
Ripple XRP $1.32 XRP -0.36% Market capitalization $81.31 billion VOL. 24 hours $76.52 million suffered a 5.53% decline on Friday, after which it found support at the 50-day EMA, which is approximately $ 2.30. As of Monday, the token is holding just above this level at $ 2.34. If this support is maintained, XRP has the potential to rise to the next resistance at $ 2.72. The RSI on the daily chart is in the neutral zone (around 50), which indicates that there is no clear advantage in the market. At the same time, the MACD also shows a bearish signal, warning of possible pressure from sellers.
Overall, the situation on the crypto market remains ambiguous. Holding key support levels may contribute to further growth, but signals from technical indicators require caution on the part of investors. Further dynamics will depend on the overall market sentiment and macroeconomic factors.