After a significant market crash, analysts emphasize positive signals for bitcoin BTC$67,634.59Mezo Wrapped BTC1.99%
Market capitalization
$39.48 million
VOL. 24 hours
$1.47 billion
. In particular, support above $ 88,000 and hidden bullish divergences indicate a possible trend recovery to new highs.
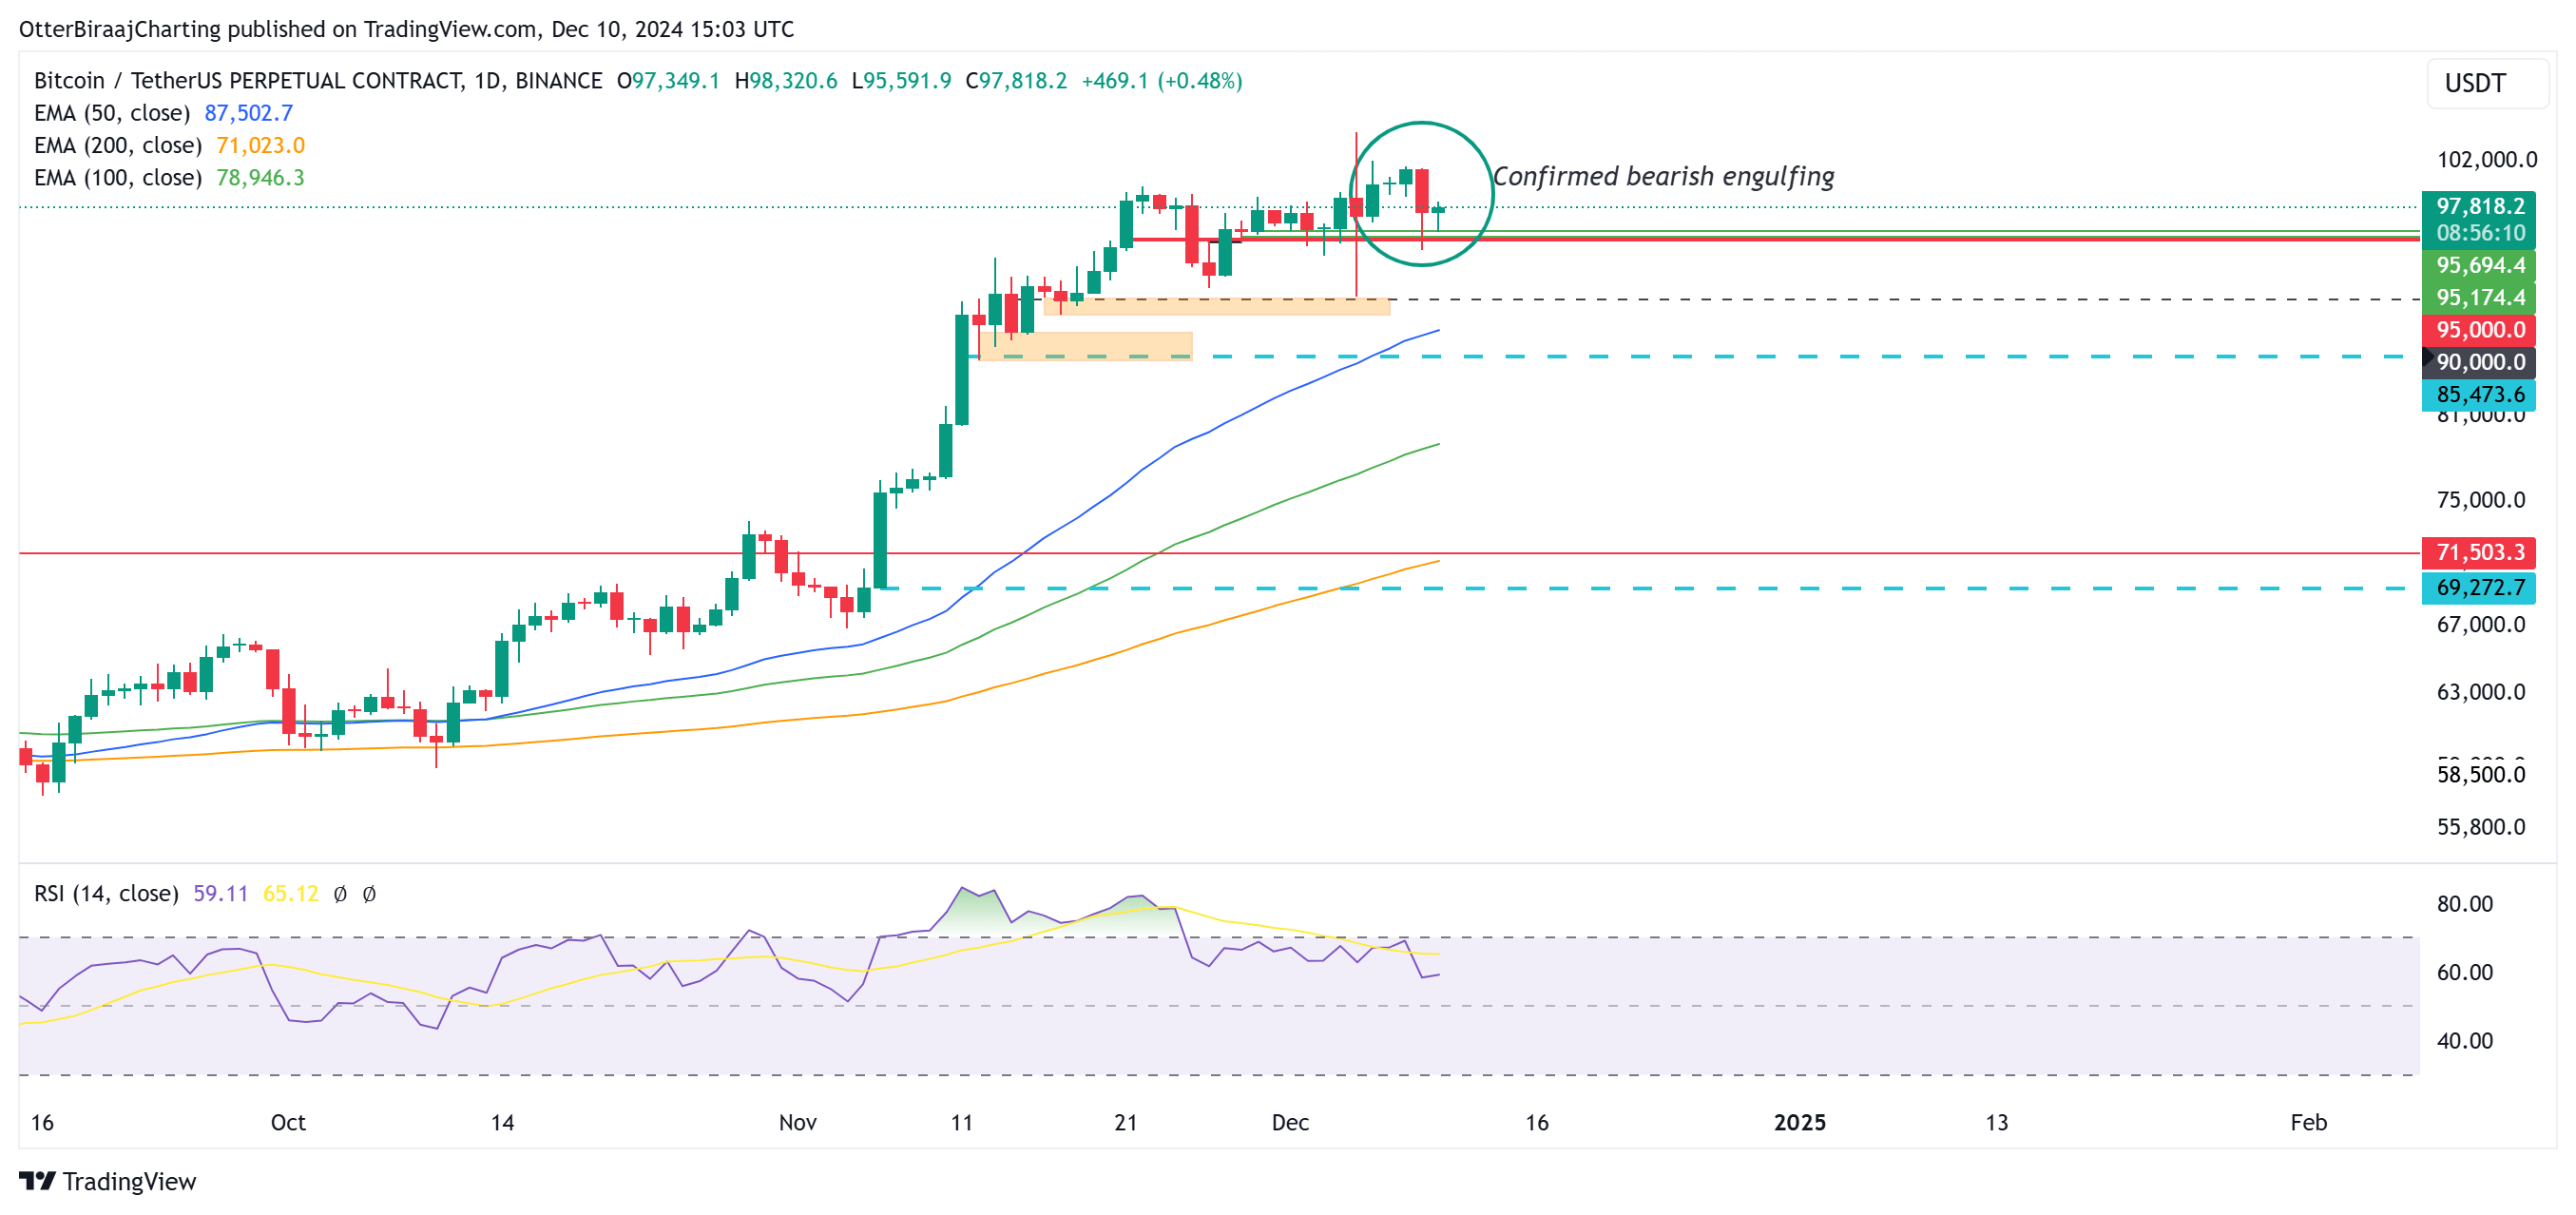
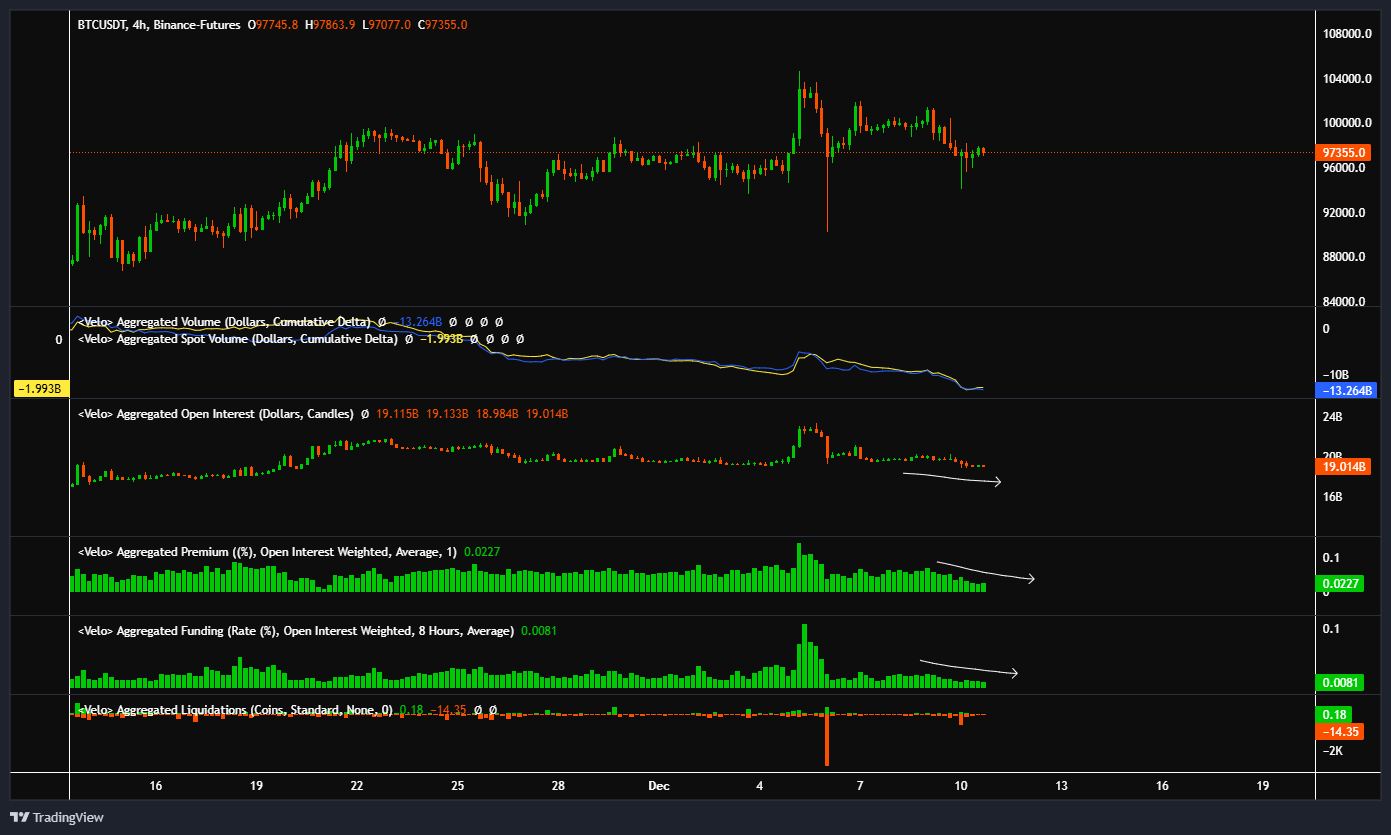
Bitcoin’s price showed a bearish pattern on the daily chart for the first time since October 21, testing support at $ 95,000 before declining further. Despite this, the long-term structure of the market remains stable.
Photo: TradingView
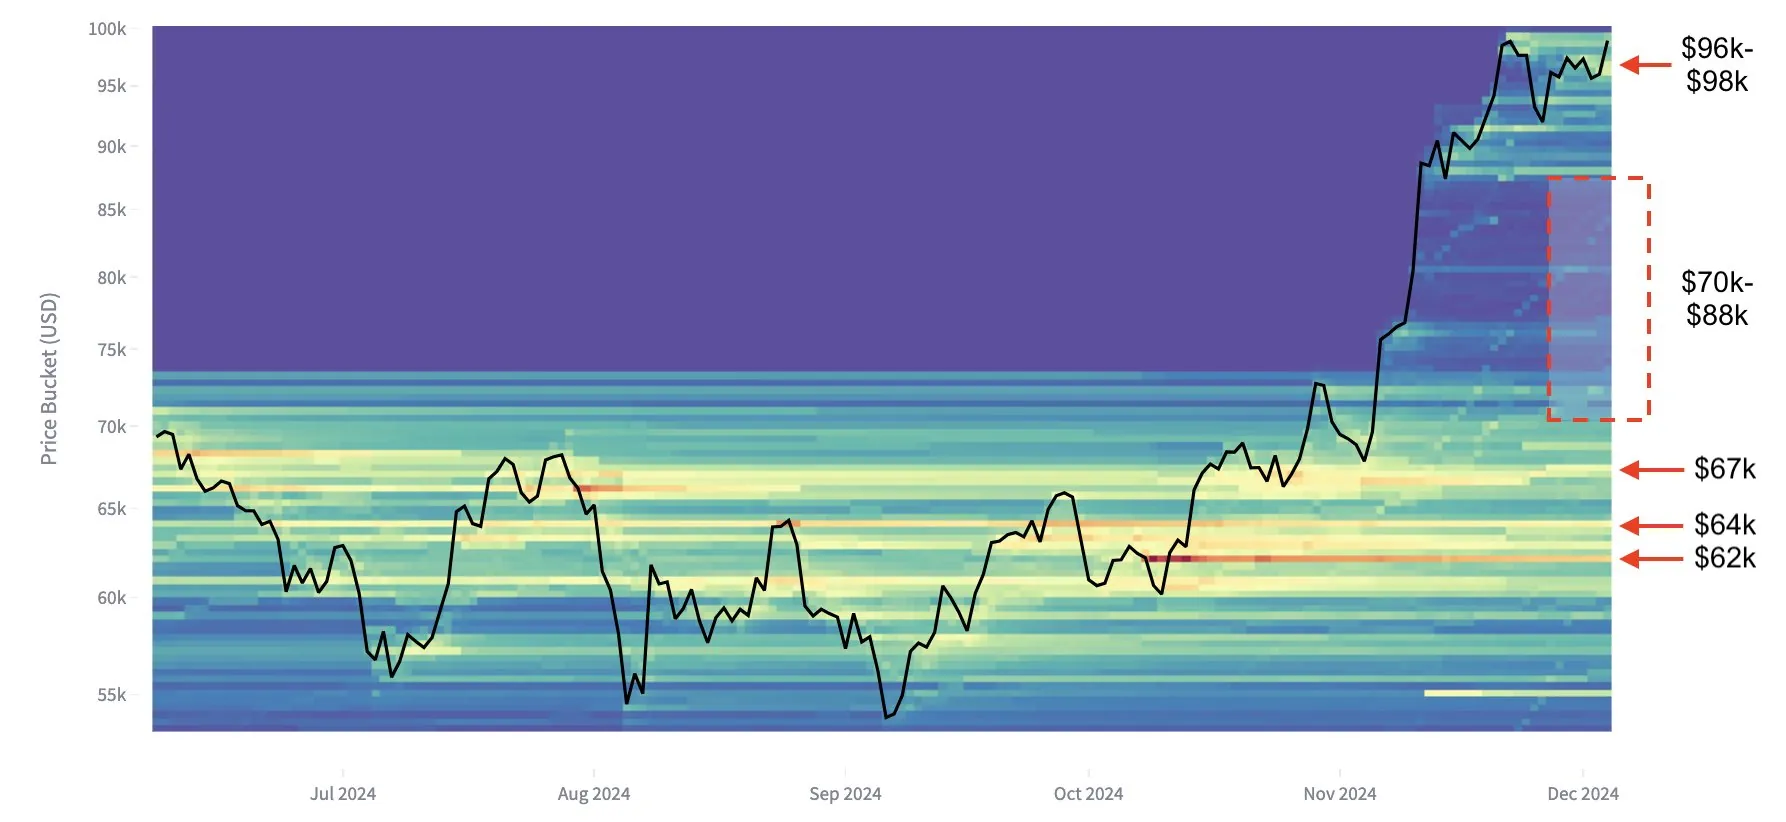
GlassNode analyst Raphael Schulze-Kraft noted that the key support level is $ 96,000, but special attention should be paid to the $ 88,000 zone. He emphasized that below this level, the accumulation of support decreases significantly, with the next major zone only at $ 70,000.
Photo: X.com
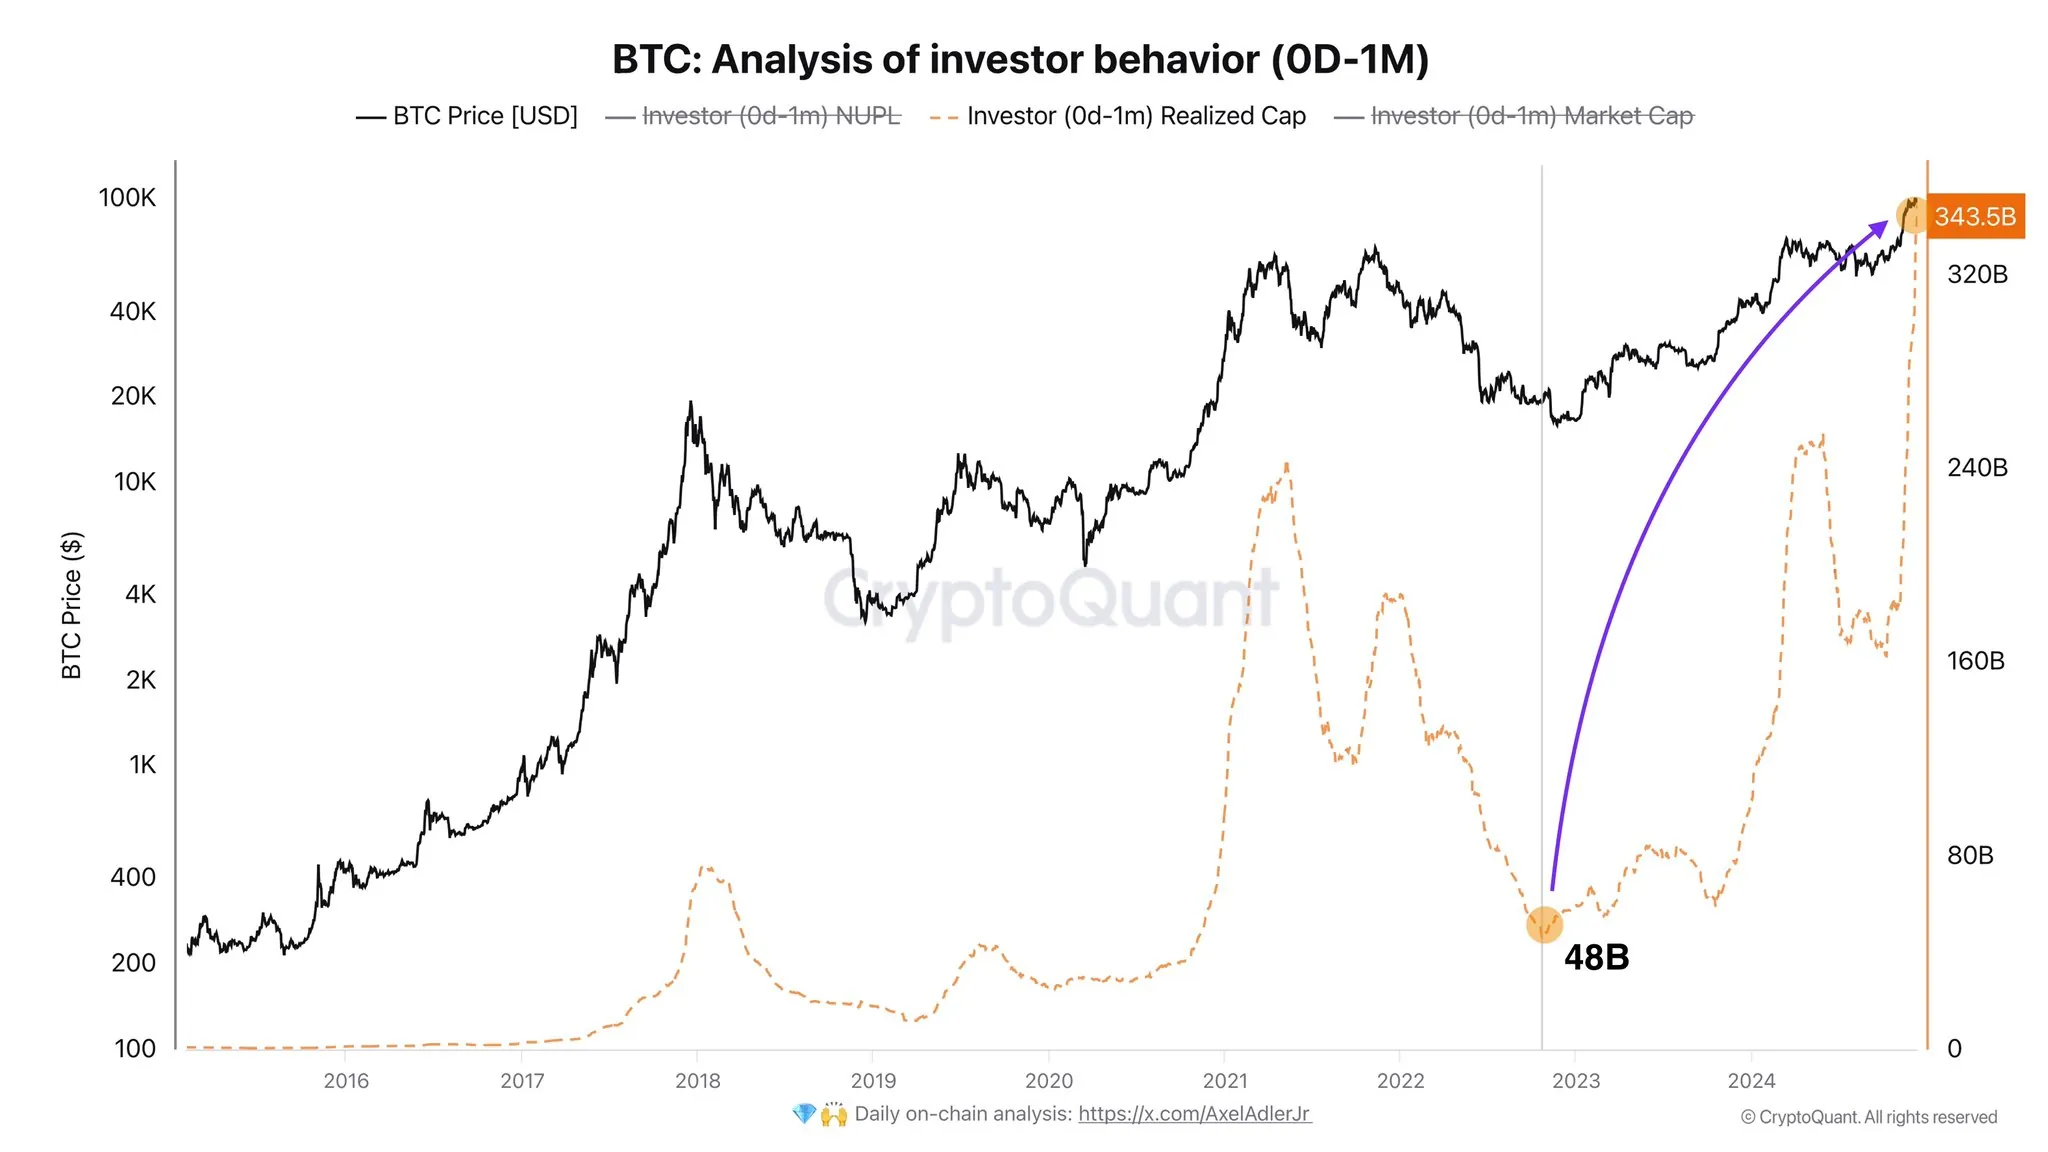
Another expert, Axel Adler Jr. noted the growth in the capitalization of new investors in bitcoin. This indicates that the market is steadily absorbing the selling pressure from long-term holders.
Photo: Axel Adler Jr.
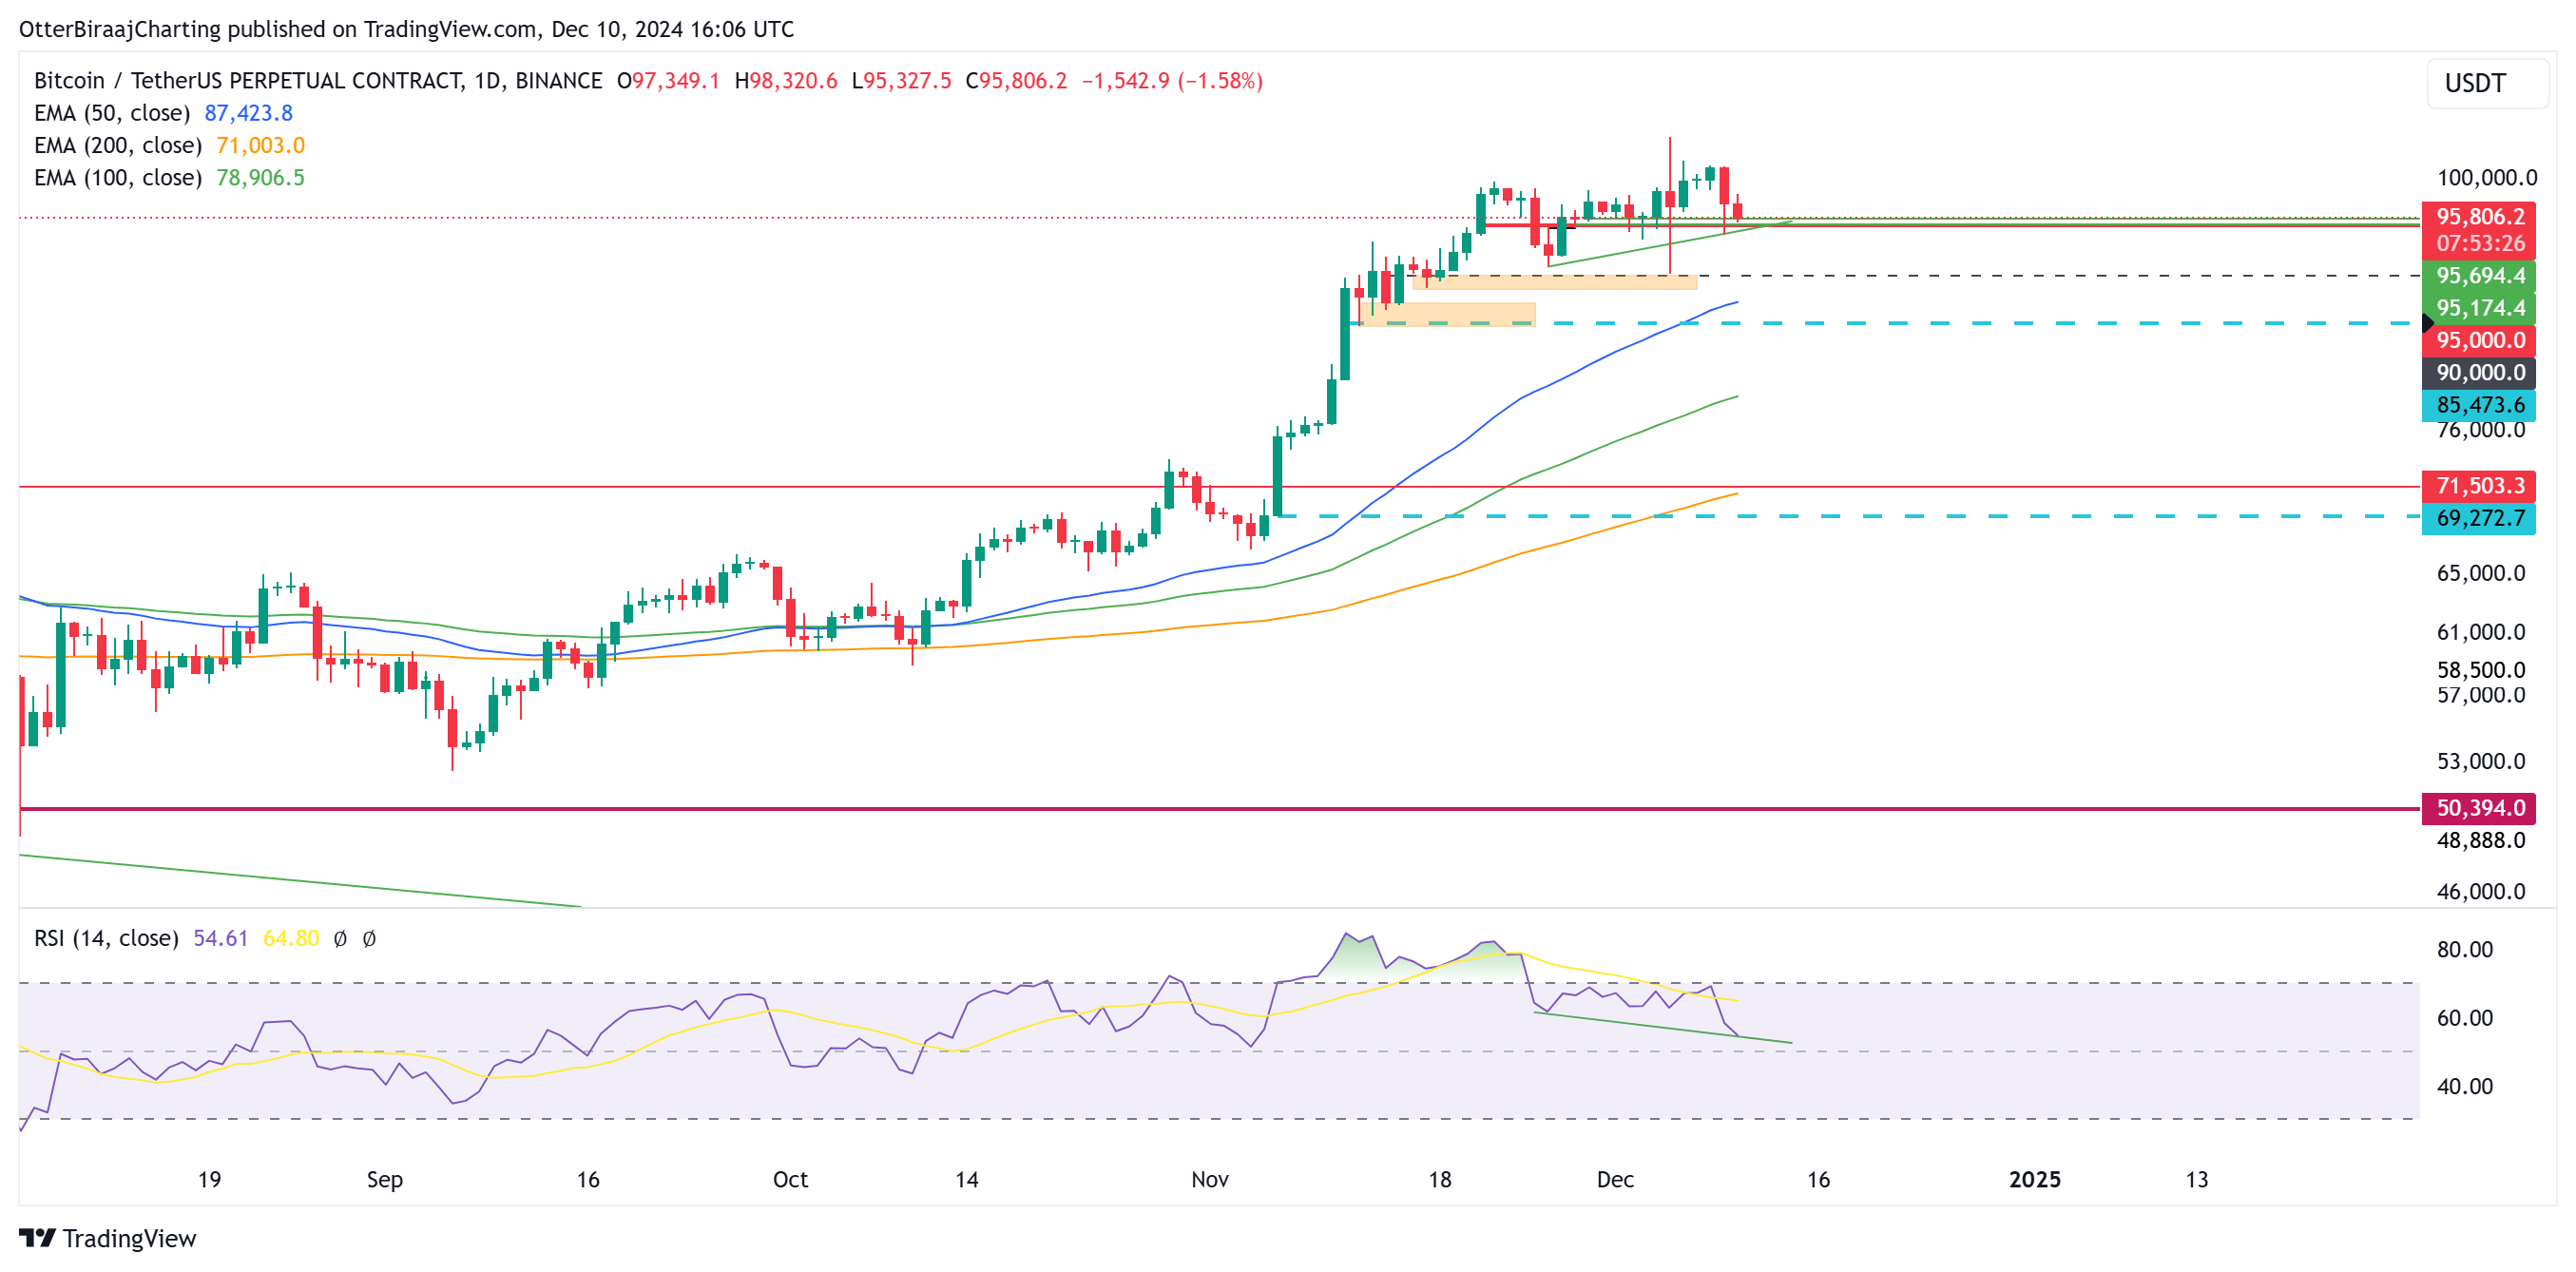
The one-day chart also shows a hidden bullish divergence between the price and the Relative Strength Index (RSI). This may indicate an increase in market momentum.
Photo: TradingView
Daan Crypto, an independent trader, noted that after the market stabilizes, bitcoin may return to an uptrend.
Photo: X.com
Given the latest data, the key to maintaining the positive trend is to keep the price above $ 90,000. If this level is maintained, analysts expect further growth and recovery of the market after the recent decline.